Test Reports
When you click the name of any test on the EAC Visual Data dashboard, a Test Report opens.
A Test Report contains detailed information about the selected test, and it consists of data tables that you can navigate on-screen or download in a variety of file formats.
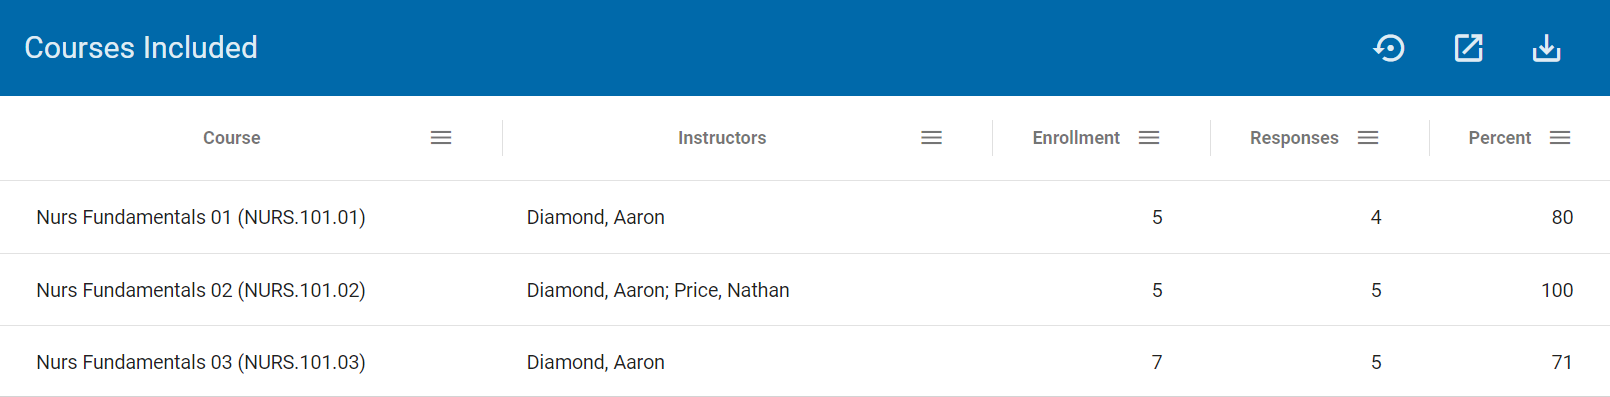
Courses Included
Courses Included provides context, including information about the courses in which the assessment was delivered and how many students participated.
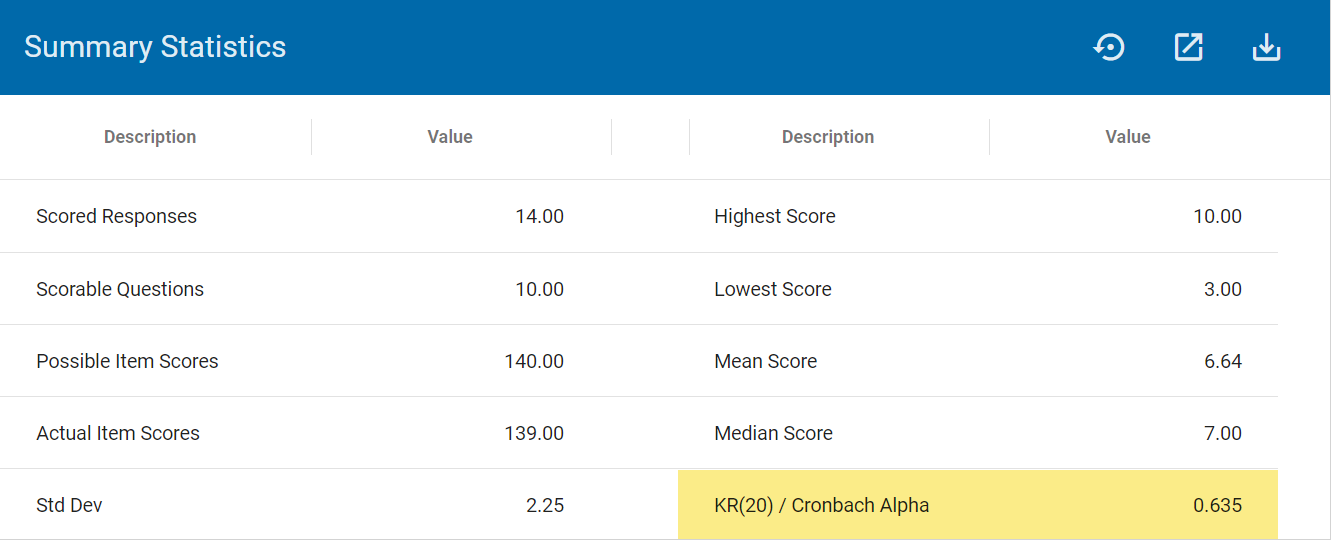
Summary Statistics
Summary Statistics provides overall information, including student High Scores, Low Scores, Mean Scores, and overall measures of reliability (KR20s).
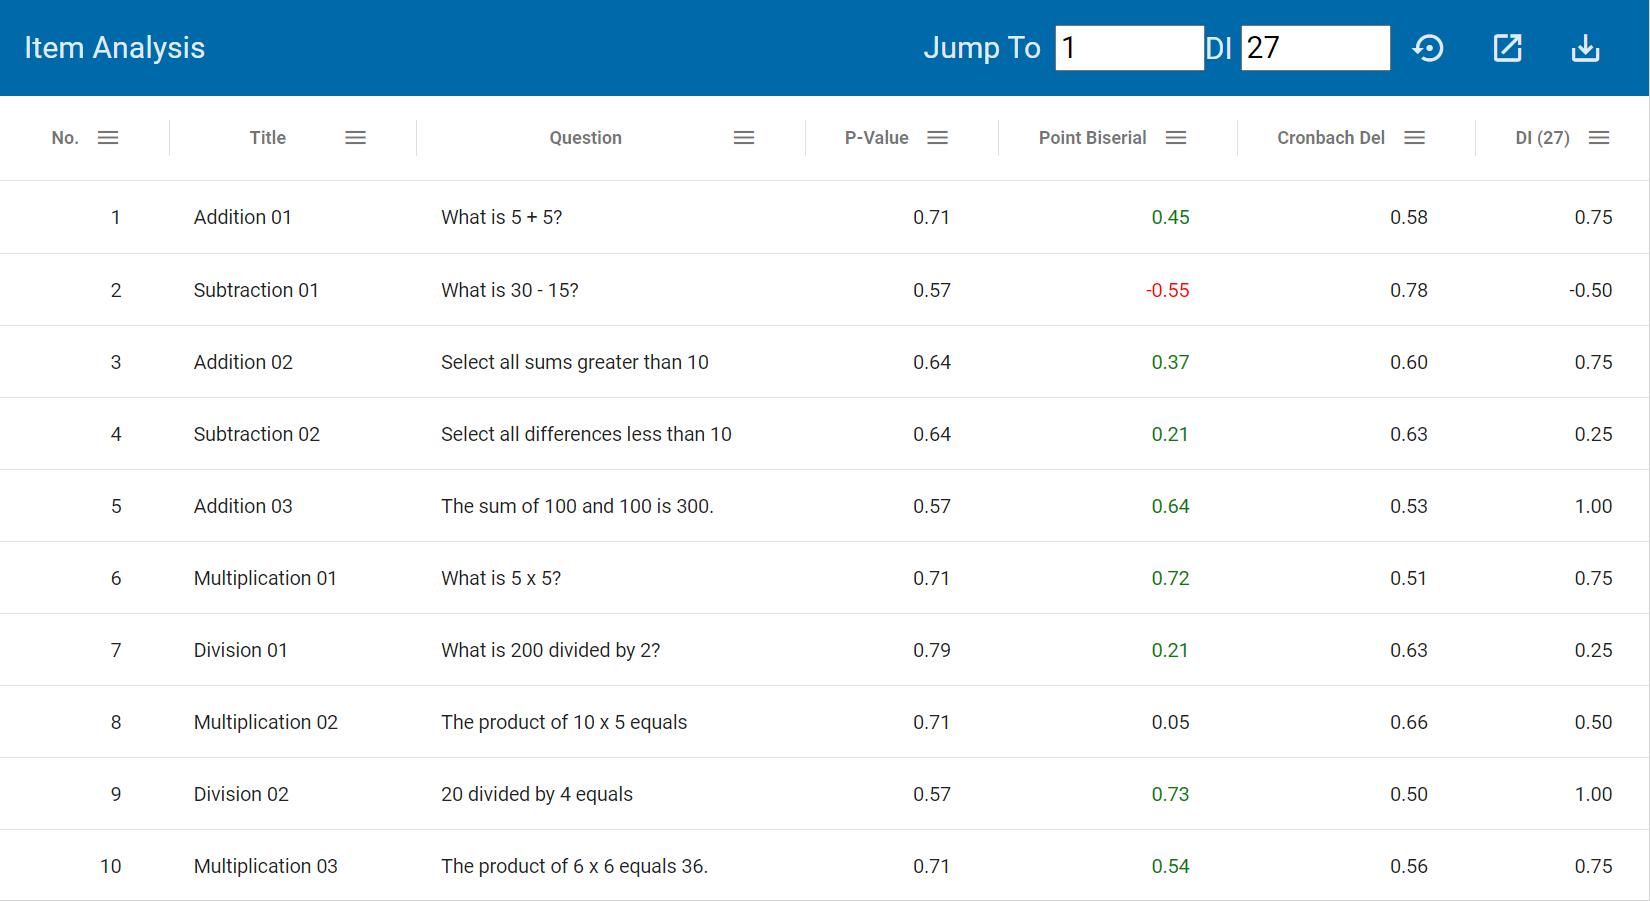
Item Analysis
Item Analysis provides statistics for each test question, including a measure of difficulty (P-Value) and measures of reliability (Point Biserial Correlation, Cronbach Alpha with Deletion, and a Discrimination Index).
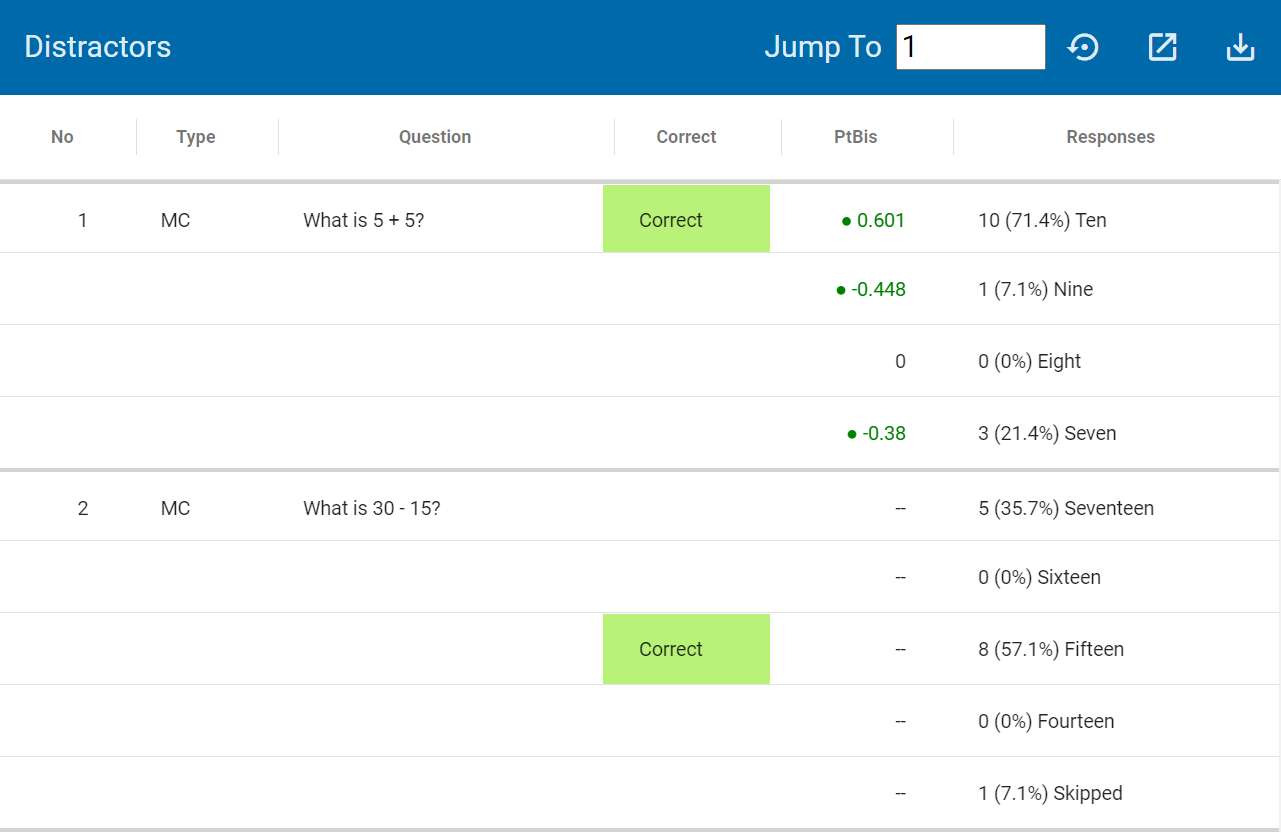
Distractors
Distractors provides more details on each test question, including a frequency distribution among correct and incorrect answers and, in limited circumstances, a measure of distractor reliability (Distractor Point Biserial Correlation).
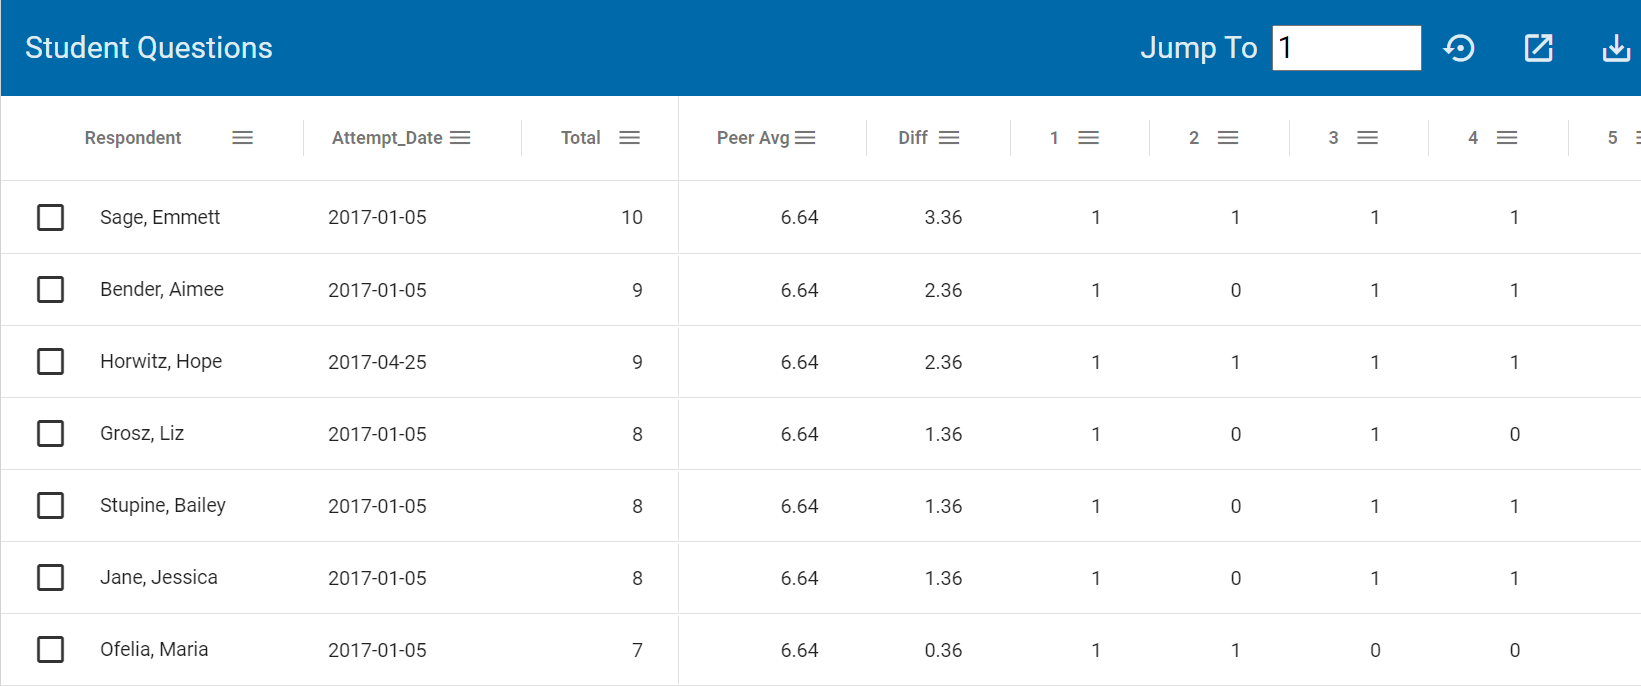
Student Questions
Student Questions provides a matrix of raw scores, including each student's name and attempt date, how each student compared to the Mean Score (Diff), and how each student performed on each test question.
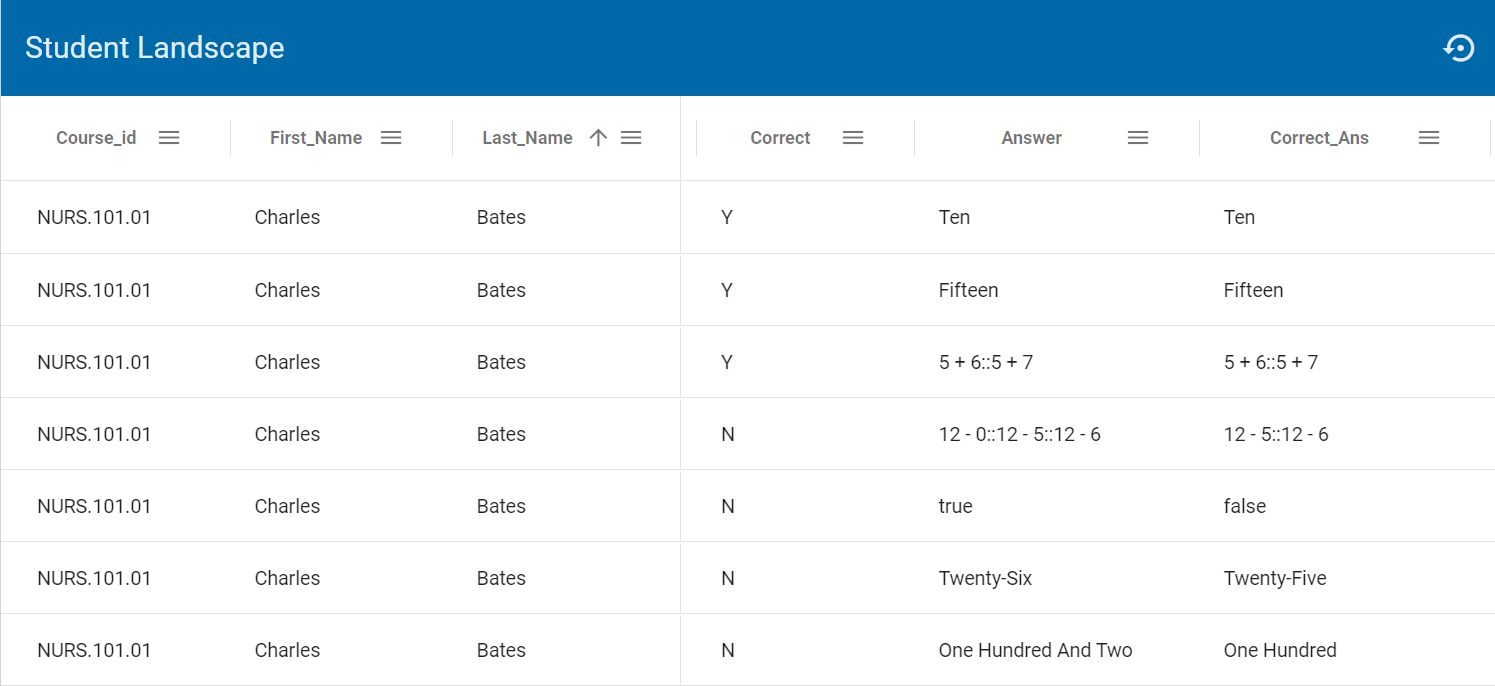
Student Landscape
Student Landscape provides more details on each student's interaction with each test question.
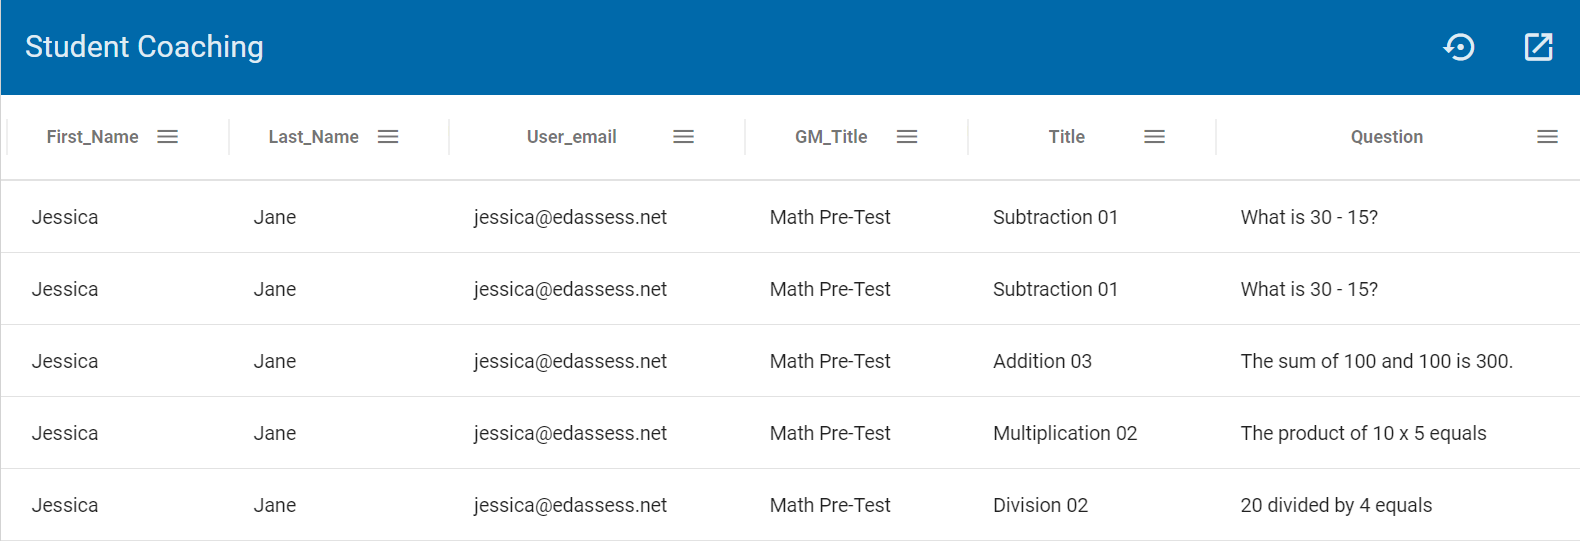
Student Coaching
Student Coaching provides details on each student's incorrect answers.