Rubric Reports
When you click the name of any rubric on the EAC Visual Data dashboard, a Rubric Report opens.
A Rubric Report contains detailed information about the selected rubric, and it consists of data tables that you can navigate on-screen or download in a variety of file formats.
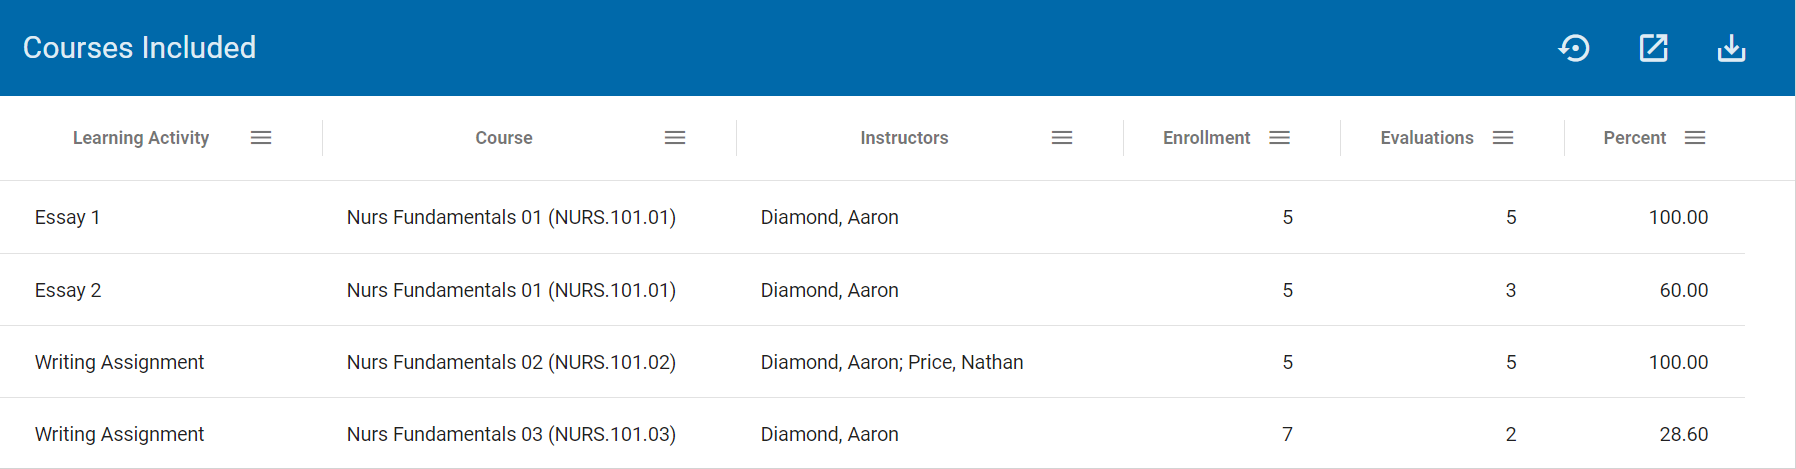
Courses Included
Courses Included provides context, including information about the courses in which the rubric was scored and how many students were evaluated.
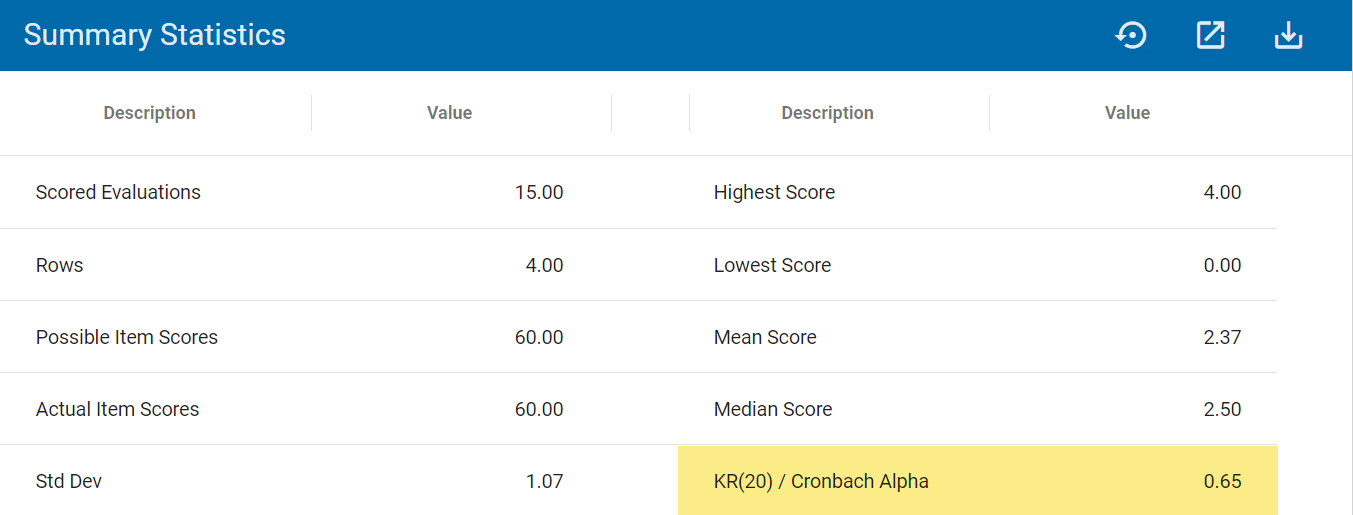
Summary Statistics
Summary Statistics provides overall information, including student High Scores, Low Scores, Mean Scores, and overall measures of reliability (KR20s).
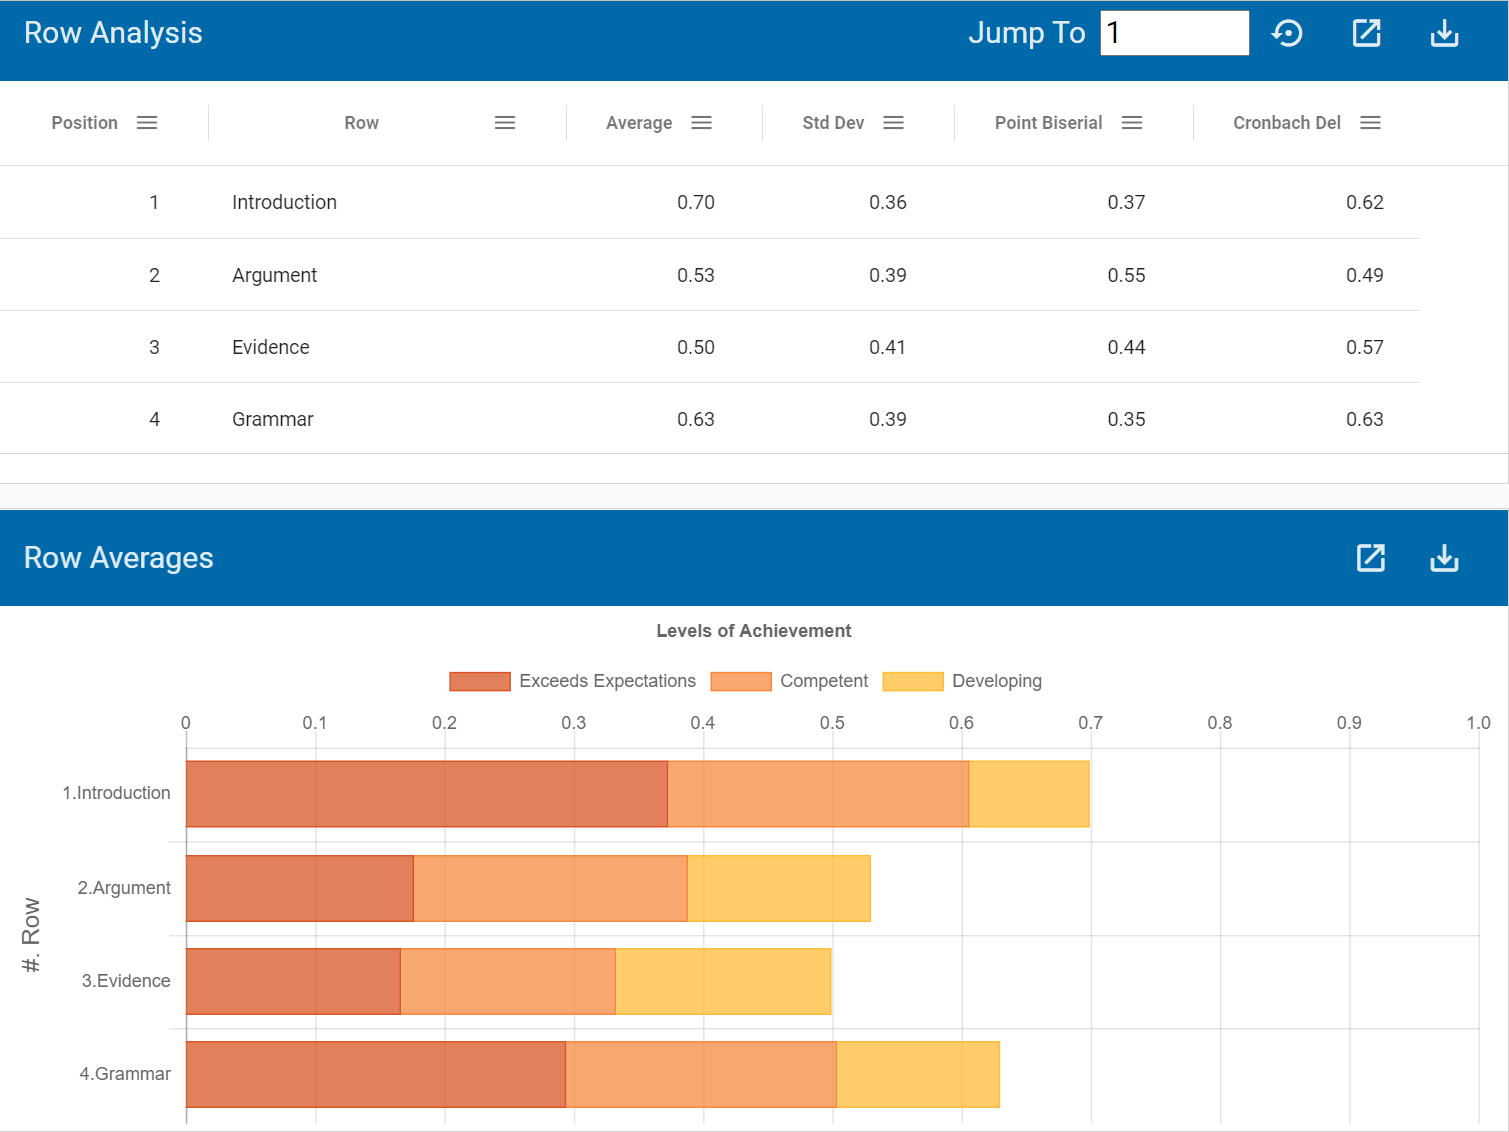
Row Analysis
Row Analysis provides statistics for each rubric row, including average scores and standard deviations as well as measures of reliability (Point Biserial Correlation and Cronbach Alpha with Deletion).
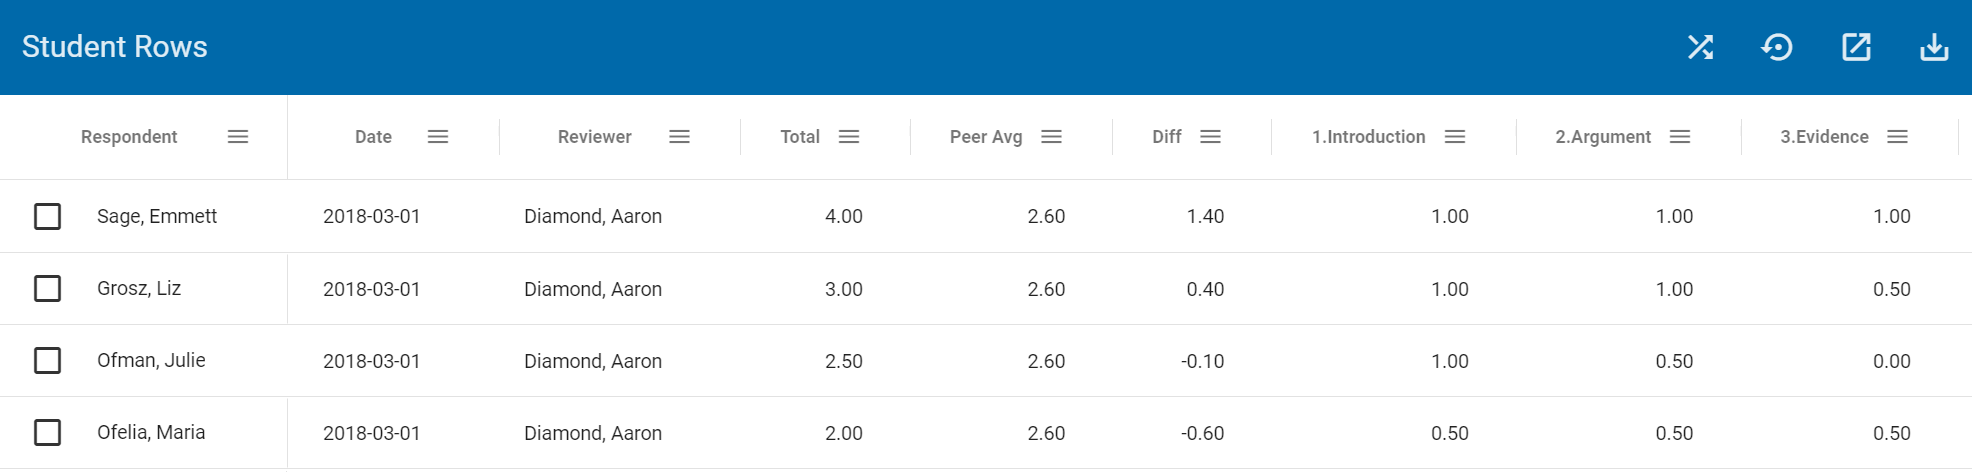
Student Rows
Student Rows provides a matrix of raw scores, including each student's name and evaluation date; how each student compared to the Mean Score (Diff); and how each student performed on each rubric row.
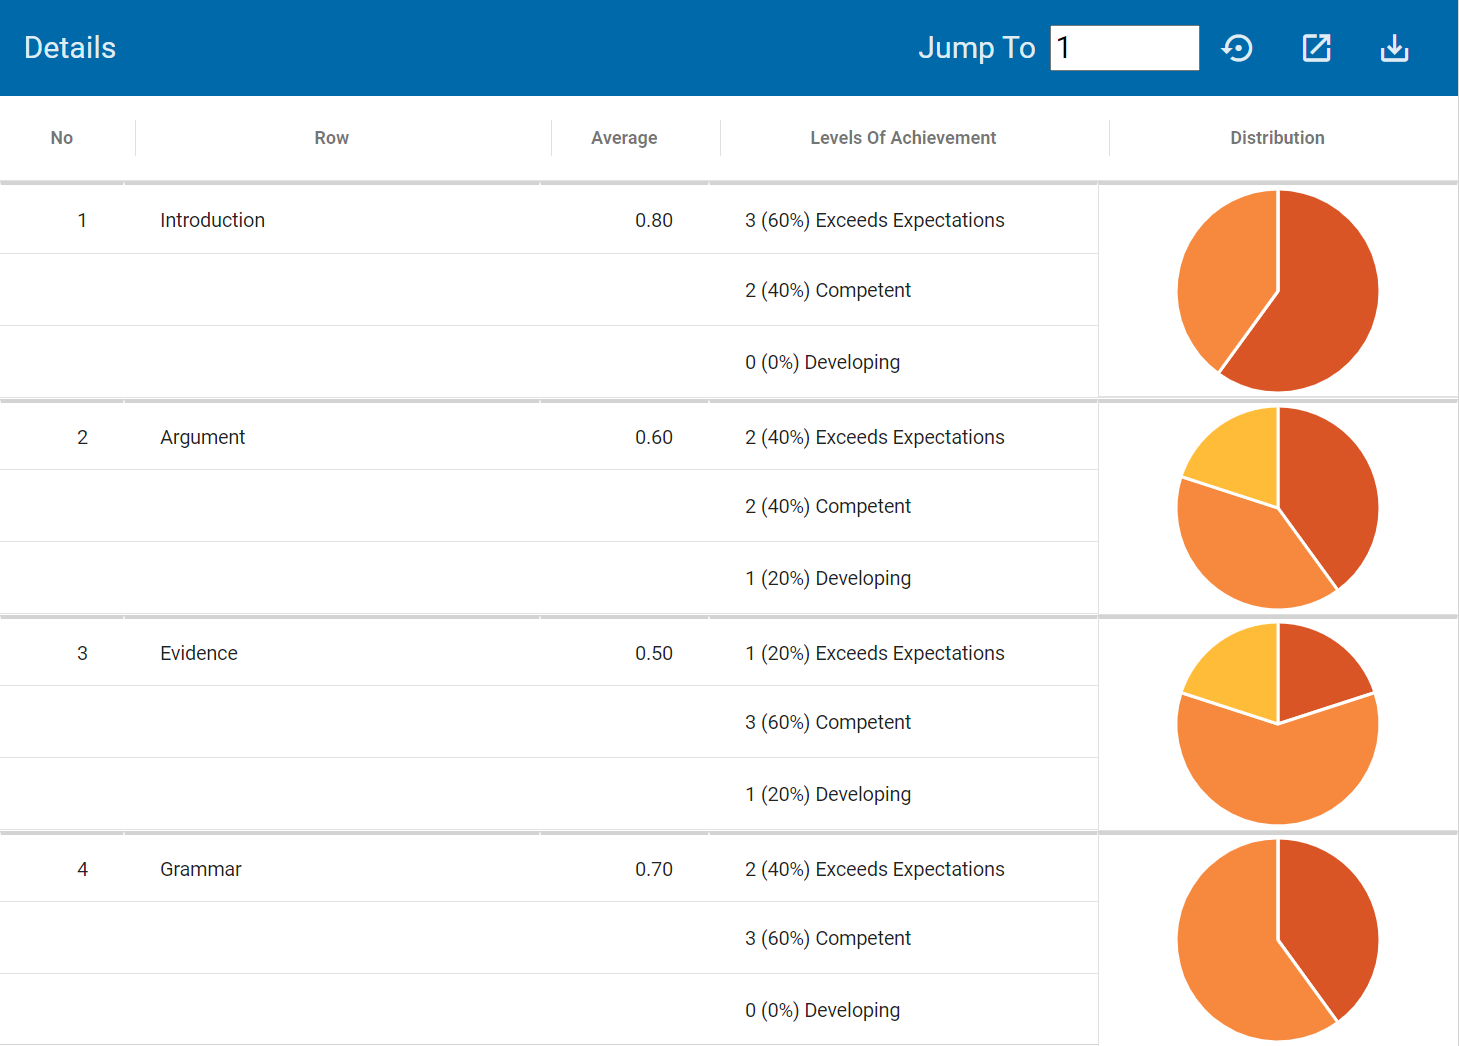
Details
Details provides more details on each rubric row, including a frequency distribution across Levels of Achievement.
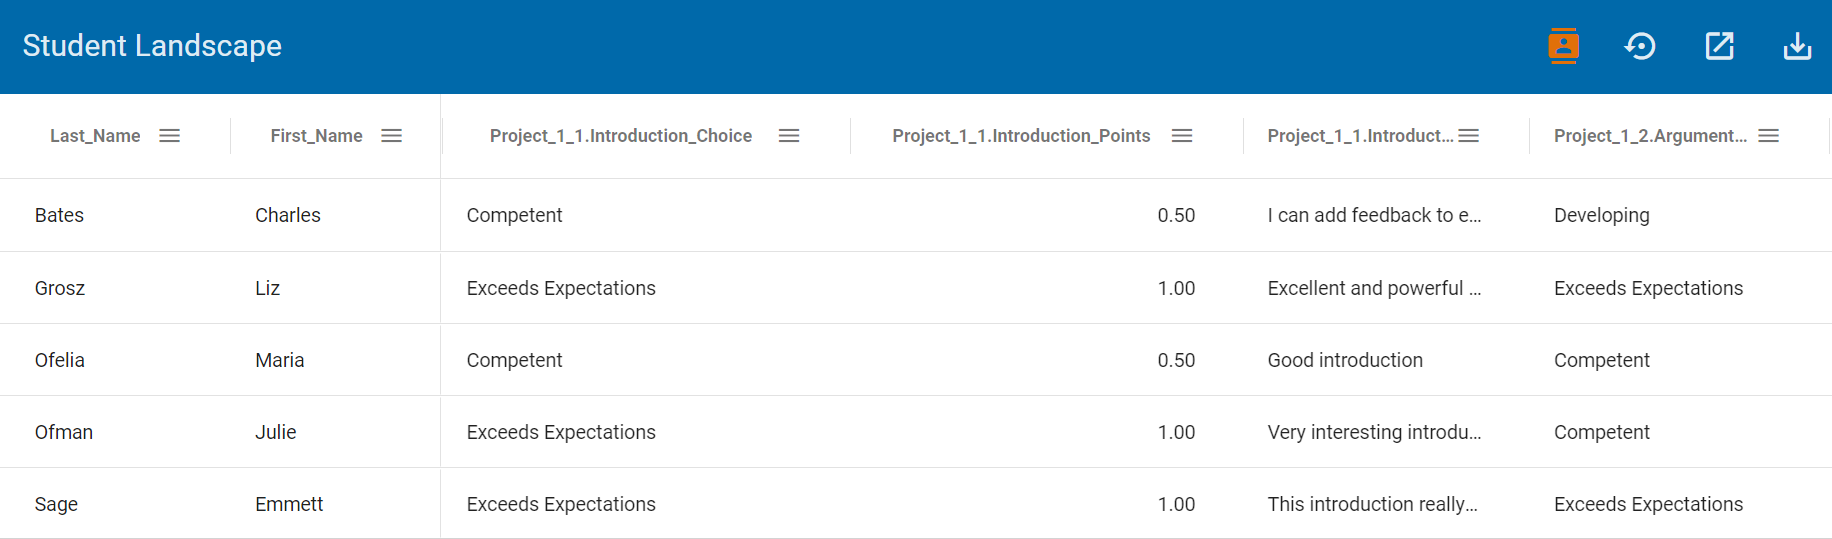
Student Landscape
Student Landscape provides more details on each student's rubric evaluation.